Brand Protection
 SEM Insights
 Affiliate Compliance
 Ad Armor
 Learning Center
 Guides & Webinars
 We Love Data™
 About Us
 Our Data
 Careers
 Our Team
 News
News Contact Us
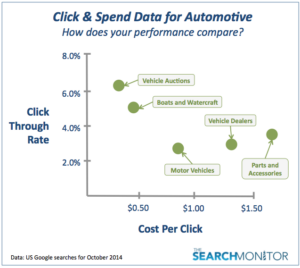
Automotive advertisers: How do your CTR and CPC benchmarks compare?
The data below comes from our Lighthouse product which focuses on click and spend benchmarks across 1,239 verticals. The chart focuses on five top spending groups within our Automotive verticals. Typically advertisers fall on a 45-degree line going from bottom-left to top-right, where higher bids lead to better ranks and more clicks. Here, we see two categories—Vehicle Auctions and Parts & Accessories—where they either over-spending or under-spending the other groups. In the case of Vehicle Auctions, how do you think they are achieving such low CPCs while still seeing a 6% CTR? And in the case of Parts and Accessories, why is it worth spending over $1.50 per click for a CTR less than 4%? Now, every search market knows it’s not just about how many clicks you generate for a given dollar of spend. It’s about how you use those clicks to drive revenue and profit. Auto parts advertisers might have higher profit margins or lower overhead than other categories, for example.
How do your CTR and CPC benchmarks compare? How often do you pull this data and see where you fall?
Share on Social
See Our Data at Work
Provide us with a competitor’s website, a set of keywords, or one of our 1,000+ verticals, and we’ll show you the power of our monitoring capabilities. Request a personalized demo today and see what our insights can do for you!
Trusted by