Brand Protection
 SEM Insights
 Affiliate Compliance
 Ad Armor
 Learning Center
 Guides & Webinars
 We Love Data™
 About Us
 Our Data
 Careers
 Our Team
 News
News Contact Us
How do your CPCs compare to the industry benchmarks?
Cost Per Click is another key performance indicator that every search marketer should monitor on a regular basis. The chart below shows CPC benchmarks for five key PPC verticals: Retail, Finance, Travel, Auto, and Telecom. Further, we included benchmarks for both top-tier and middle-tier advertisers. Why the need for two tiers of benchmarks? For starters, you don’t want to spend too much based on your tier. And second, seeing data for a tier above you helps you get approval for increasing your spend to be more competitive. (Agencies, pay attention to this benefit!) So, how does your CPC compare?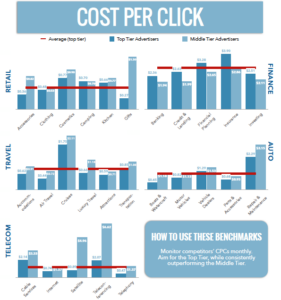
Source: Lighthouse — Google & Bing (Q2 2015)
Highlights From the CPC Chart
- Finance: As we have seen in the past, Finance saw the highest CPC of the five verticals. Advertisers in this highly competitive vertical have to pay to play. Finance is also the only vertical that saw top-tier advertisers spending more than what middle-tier advertisers spend. Usually the top-tier players benefit from their larger, more advanced status to pay less.
- Retail: Retail saw the lowest average CPC over the five verticals, with an average of $0.50 CPC. With lower average order values comes lower CPCs (usually).
- Telecom: Telecom saw the two highest CPCs, with teleconferencing coming in at $6.62 and Satellite coming in at $4.96 for the middle-tier advertisers.
Share on Social
See Our Data at Work
Provide us with a competitor’s website, a set of keywords, or one of our 1,000+ verticals, and we’ll show you the power of our monitoring capabilities. Request a personalized demo today and see what our insights can do for you!
Trusted by