Brand Protection
 SEM Insights
 Affiliate Compliance
 Ad Armor
 Learning Center
 Guides & Webinars
 We Love Data™
 About Us
 Our Data
 Careers
 Our Team
 News
News Contact Us
Seasonality and CTRs: What’s the connection?
September 30, 2015
How does seasonality impact clickthrough rates (CTRs)?
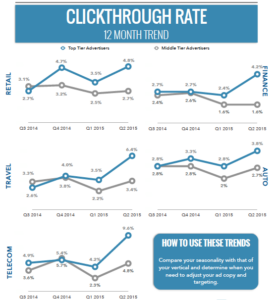
The chart below shows CTR benchmarks for five key PPC verticals—Retail, Finance, Travel, Auto, and Telecom—during the past four quarters, and for two important benchmark groups:
- The Search Monitor’s top-tier advertisers (the group of 10 advertisers who received the most clicks during the quarter)
- The Search Monitor’s middle-tier advertisers (the group of 10 advertisers whose click volumes represented the middle of the click volume witnessed during the quarter)
How do these trends compare with your clickthrough rate data?
 Source: Lighthouse — Google & Bing (Q3 2014-Q2 2015)
Highlights From the CTR Trend Chart
- Retail: In 2014, Q4 had much higher clickthrough rates versus Q3 (to be expected given the holiday season). The big surprise, however, was the spike in CTRs during Q2 of 2015, actually higher (slightly) than Q4 of 2014. Since our group of retail keywords is fairly broad, we’d be interested to see if this Q2 spike was driven by a few specific summer-related retail categories.
- Travel: For top-tier advertisers, Q2 saw significantly higher CTRs. Summer vacation planning season, perhaps?
- Telecom: Telecom saw the highest average CTR of all five verticals analyzed (9.6%), with the highest CTRs coming in Q2 for top-tier advertisers. Which telecom sub-verticals drove the Q2 spike?
Share on Social
See Our Data at Work
Provide us with a competitor’s website, a set of keywords, or one of our 1,000+ verticals, and we’ll show you the power of our monitoring capabilities. Request a personalized demo today and see what our insights can do for you!
Trusted by